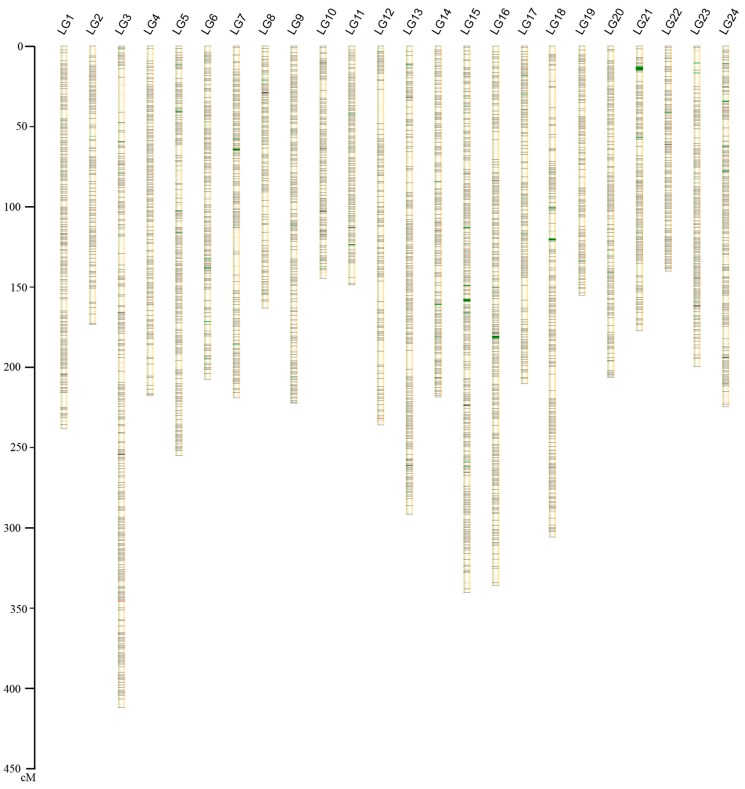
Figure 1.
Linkage group lengths, genes involved in immunity and hypoxia adaptation, and marker distribution of the high-density SNP genetic map of large yellow croaker. NOTE: in each group, black lines represent SNPs, red lines represent genes involved in immunity and green lines represent genes involved in hypoxia adaptation. Genetic map details were given in Table S2.

