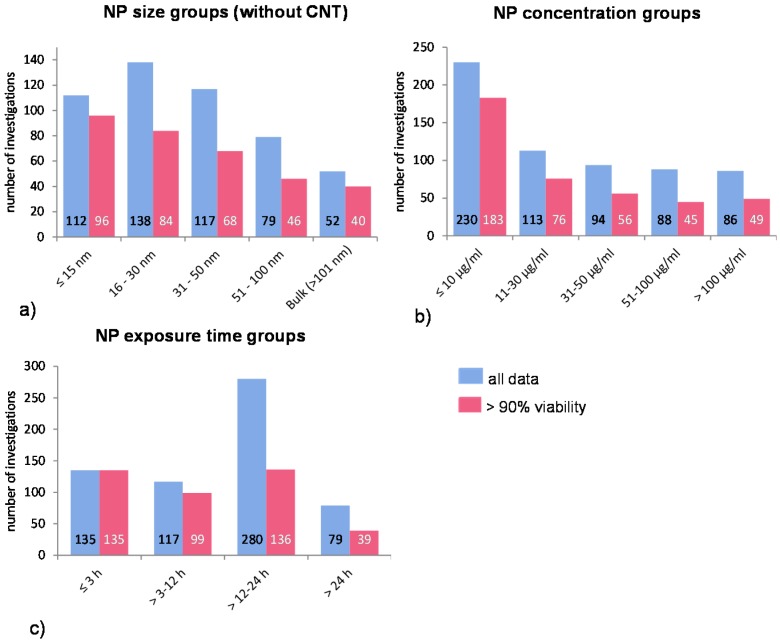
Figure 1.
Distribution of all investigations according to NP (a) size- (without CNT data); (b) concentration-; and (c) exposure time groups. The blue bars represent the mean ROS ratios of all data, and the red bars the ROS ratios of cells with more than 90% viability. Data are illustrated as mean, and numbers inside the bars represent the number of investigations.

