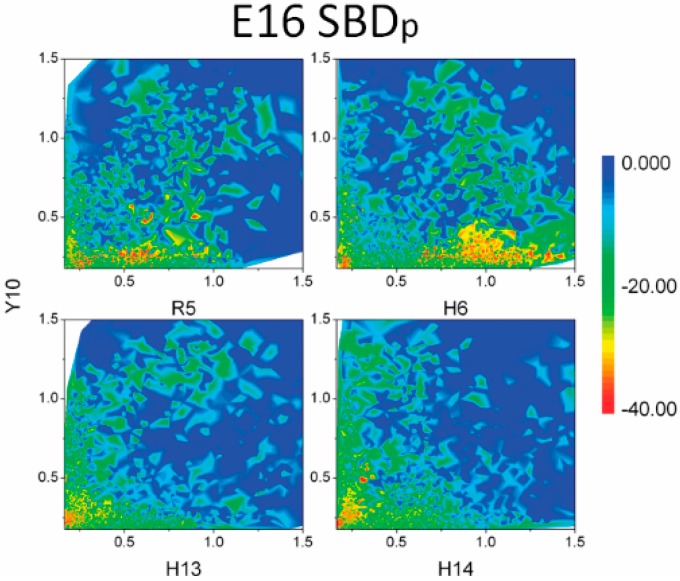
Figure 10.
MM-GBSA binding energies (Kcal/mol) between SBD and GT1b gangliosides. Distances of salt bridge and CH–π interaction were set as two coefficients of variation. Distances of salt bridges between positive residues (R5, H6, H13 and H14) and Neu5Ac were set as the horizontal axis, and distances of CH–π interactions between aromatic rings of Y10 and CH groups in sugar rings were set as the vertical axis.

