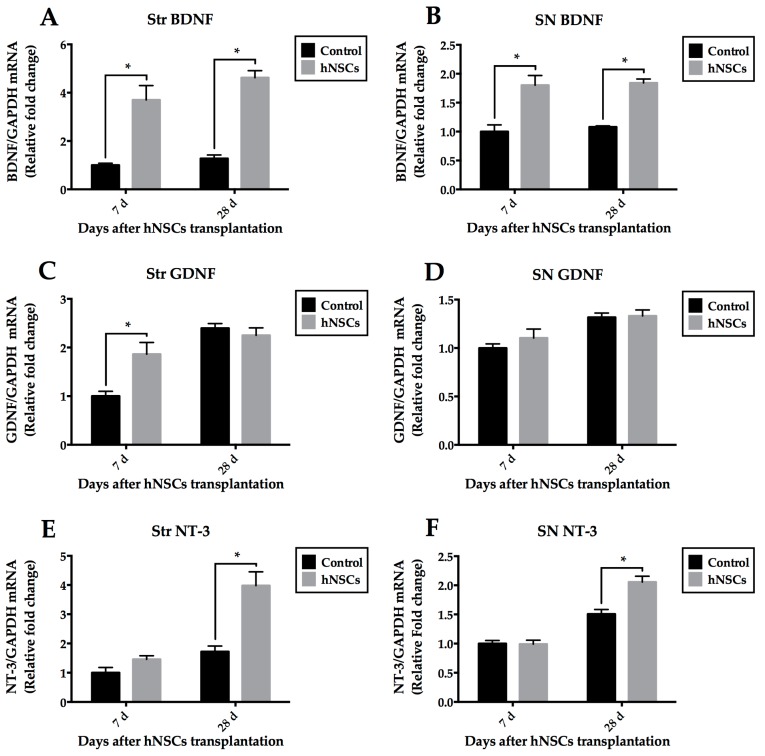
Figure 7.
QRT-PCR analysis of host-derived BDNF, GDNF, and NT-3 mRNA levels in different tissues (Str and SN). BDNF was significantly up-regulated at each time point in mice receiving hNSCs (A,B); The effect was also seen in the treated mice with a trend towards greater increase of NT-3 mRNA levels compared with control mice, but it did not achieve significant difference at seven days (E,F); No difference of GDNF levels was observed at each time point except for expression at seven days in the striatum (C,D). All results were normalized to GAPDH mRNA levels and expressed as relative fold change to the levels at 7-day of the control group. Data are expressed as mean ± SEM (* p < 0.05; two-way ANOVA). QRT-PCR, real time quantitative reverse transcriptase polymerase chain reaction; BDNF, brain-derived neurotrophic factor; GDNF, glial cell line-derived neurotrophic factor; NT-3, neurotrophin-3; Str, striatum; SN, substantia nigra; GAPDH, Glyceraldehyde 3-phosphate dehydrogenase.

