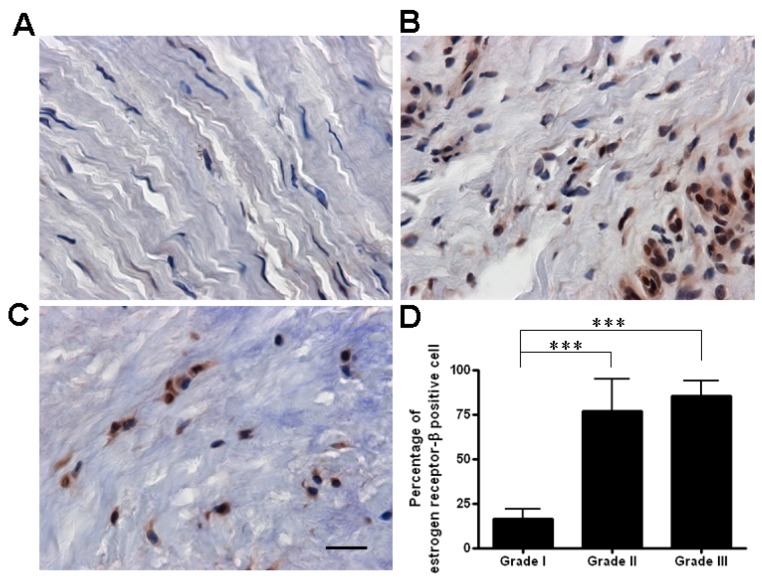
Figure 2.
The percentage of ER-β-positive cells in grade I samples (A) was lower than in grade II (B) and grade III (C) samples (immunohistochemical staining, 400× magnification, scale bar = 10 μm); and (D) There were significantly more ER-β-positive cells in grade II and grade III areas than in grade I areas. The positive percentage was calculated as: (number of positive cells/total cells) × 100%. Data are mean ± standard deviation. *** p < 0.001.

