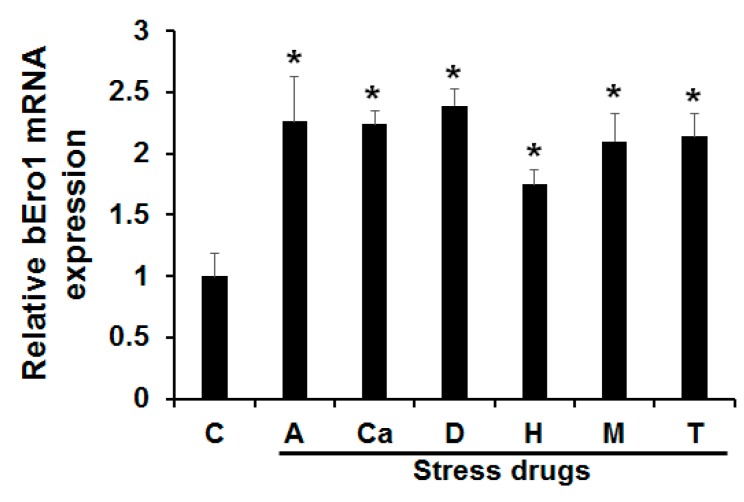
Figure 3.
Effects of various endoplasmic reticulum stresses on bEro1 expression. Bm5 cells were treated with 8 μM antimycin (A), 10 μM calcium inophore A23187 (Ca), 3 mM dithiothreitol (D), 100 μM H2O2 (H), 100 μM monensin (M), and 5 μg/mL of tunicamycin (T) for 4 h. (C) indicates the control without ER stress reagent. Relative expression levels are presented as the mean ± SD (n = 3); * p < 0.05 versus control.

