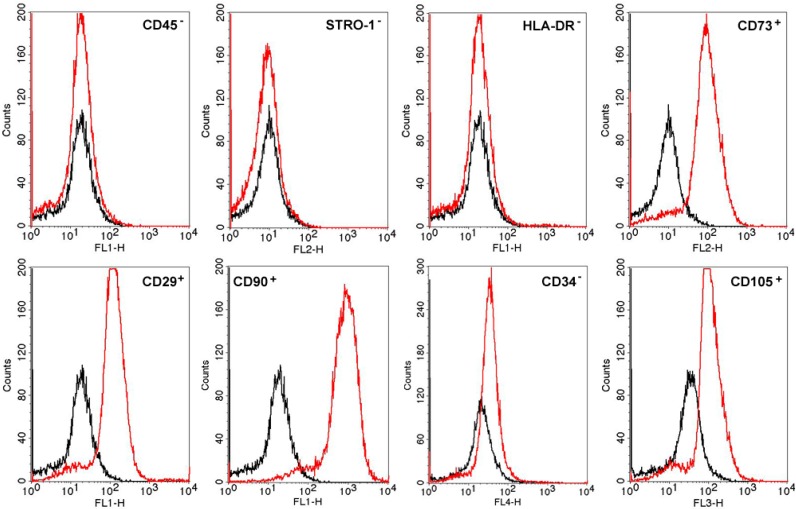
Figure 1.
Results of flow cytometry analysis of the AT-MSCs. The cells were expanded to the fourth passage and analyzed by flow cytometry (10,000 cells were analyzed). Black histogram represents the expression of each molecule of IgG (negative control) and red histogram shows different markers investigated in the cell membrane of AT-MSCs.

