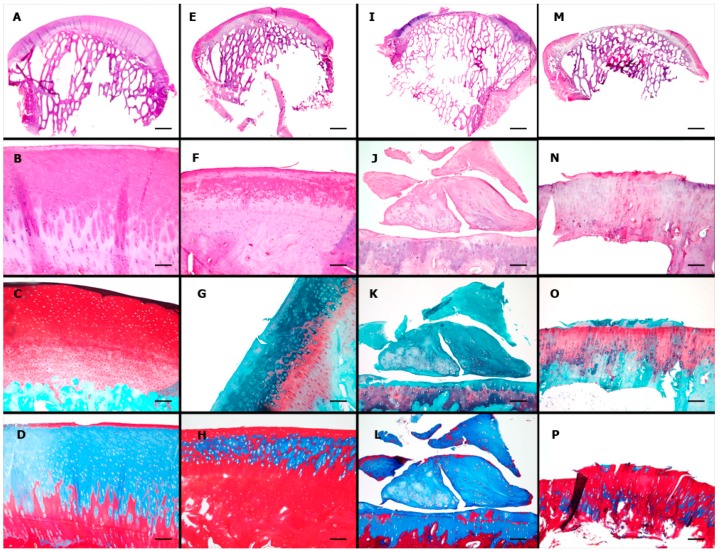
Figure 7.
Microscopic results: first row, panoramic view; second row, H&E stain; third row, Safranin O (used to color in red the glycosaminoglycans); and fourth row, Masson’s trichrome (used to color in blue the collagens and new connective tissues). (A) Panoramic view by scanning; scale bar = 2 mm; (B–D) objective, ×10; scale bars = 100 μm: normal ovine cartilage; (E) scanning; scale bar = 2 mm; (F–H) objective, ×10; scale bars = 100 μm: group CELLS; a smooth continuous surface with complete horizontal filling and complete integration to the borders, but partial vertical filling of the defect and an heterogeneous Safranin O staining of the extracellular matrix; (I) scanning; scale bar = 2 mm; (J–L) objective, ×10; scale bars = 100 μm: group SCAFFOLD; defect partially filled with fibrocartilage; (M) scanning; scale bar = 2mm; and (N–P) objective, ×10: group EMPTY; defect unfilled. Scale bar = 100 μm.

