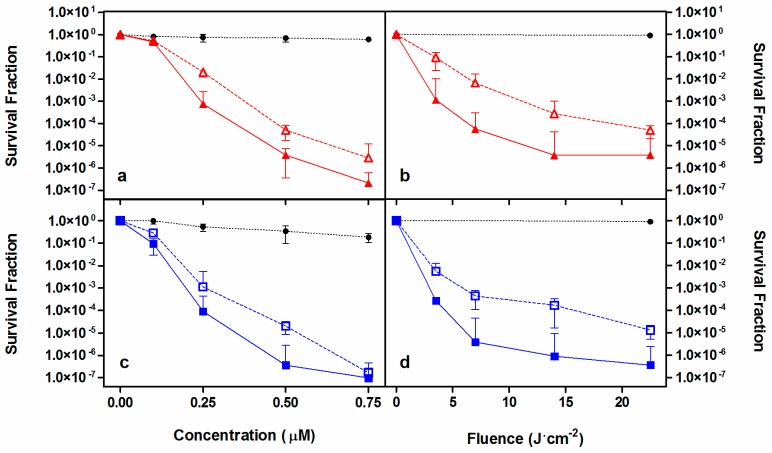
Figure 4.
Photoinactivation studies against MRSA. Survival curves of 1 (red, a,b) and 2 (blue, c,d) removing (empty symbol) or not (filled symbol) the PS excess from the solution before irradiation. Solid and dashed lines connecting data series provided for visualization purposes. Black symbols are the controls. Fluence was maintained at 22.5 J·cm−2 (a,c) and PS concentration of 500 nM was assayed (b,d).

