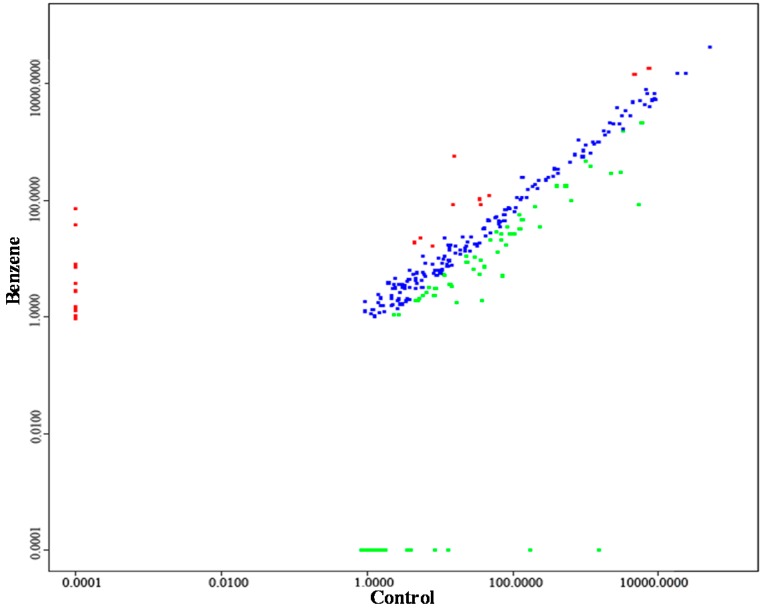
Figure 2.
Scatterplot showing the relationship between the benzene exposure group and the control group. Red dots indicate the 2-fold upregulated miRNAs and green dots indicate the 2-fold downregulated miRNAs compared with the control group. Blue dots indicate no differences between two groups. n = 3 for each group.

