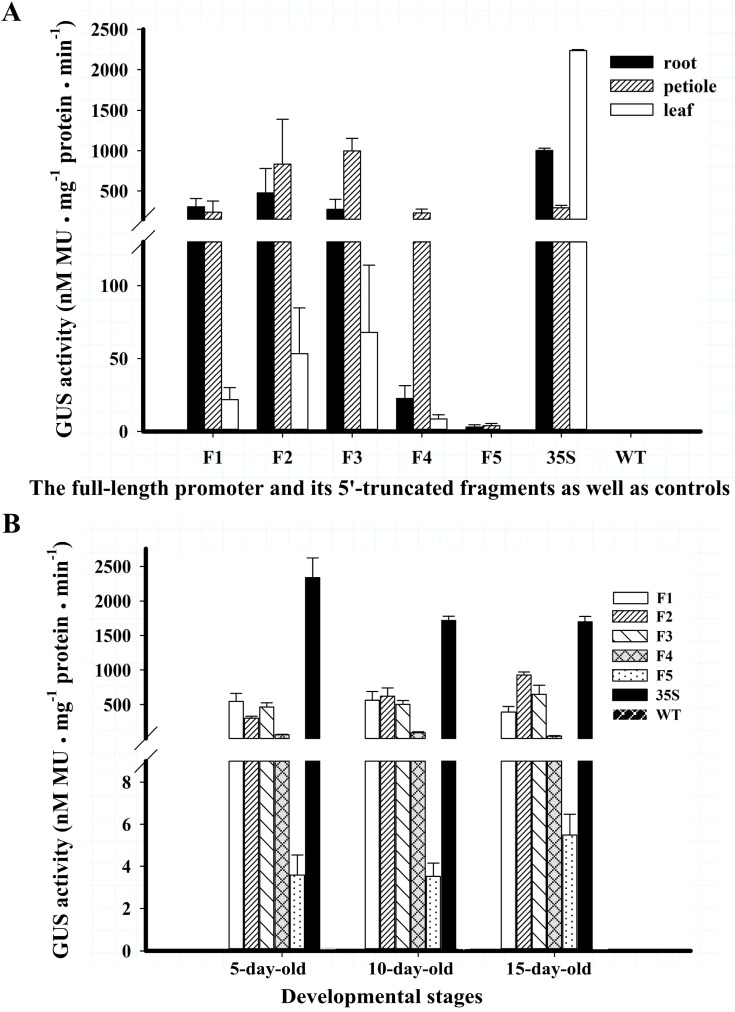
Figure 3.
The GUS activities of T3 Arabidopsis. Data are shown as mean values of three independent lines of each construct ± SD. (A) The GUS activity measured in root, petiole and leaf of 15-day-old different construct transgenic seedlings; (B) GUS activity driven by serial 5′-truncated BvcPPOPs and CaMV 35S as well as WT control in different developmental stages. GUS activity of single line of each construct was present in Figure S3.

