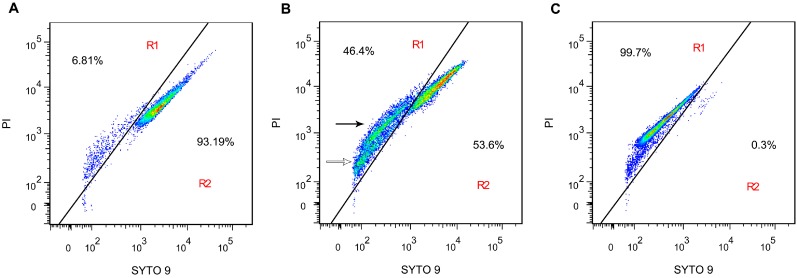
Figure 3.
Flow cytometric analysis of S. aureus ATCC 6538 stained by SYTO 9 and propidium iodide (PI). (A) untreated; (B) treated with shikimic acid at 1 × MIC for 3 h; and (C) positive control, treated with 70% isopropanol for 3 h. R1, membrane disrupted cells gate; R2, viable cells gate. Two fluorescent populations are observed in R1 with a higher fluorescent intensity (black arrow) and lower fluorescent intensity (white arrow). The red, green, and blue colors represent the decrement of cell density.

