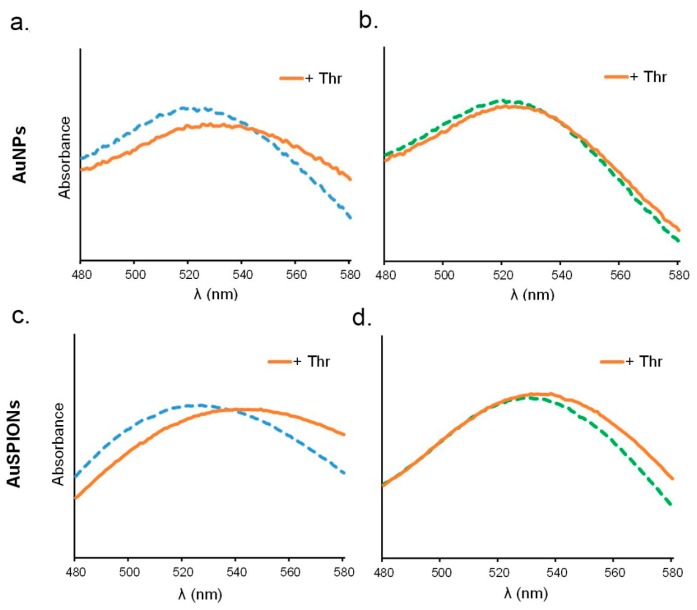
Figure 3.
UV–Visible spectra of the complex formation between TBAs and α-thrombin at a molar ratio of (1:1). The curves represent the mixture of NPs–TBAs in the absence (dashed lines) and in the presence (orange continuous lines) of the α-thrombin. Blue represents unmodified TBAs and green, methylated TBAs: (a,b) display spectra recorded for AuNPs; and (c,d) display spectra recorded for AuSPIONs.

