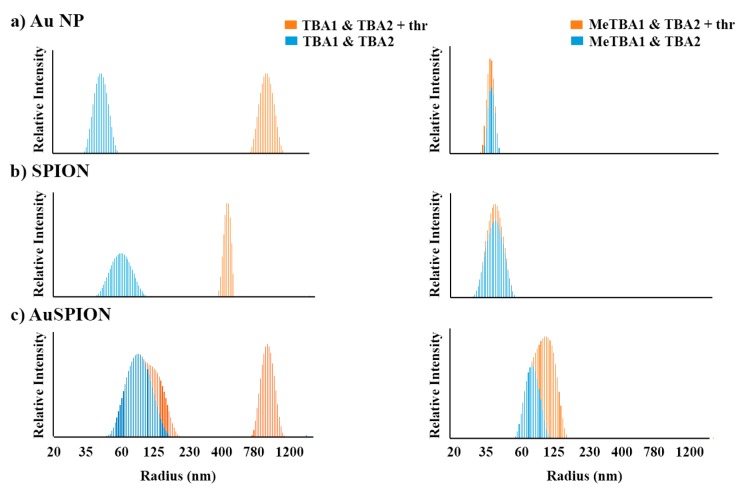
Figure 4.
Particle size distribution of NPs-TBAs at 25 °C recorded by DLS. The mixtures of TBA1 and TBA2 NPs (left) and O6−MeG-TBA1 and TBA2 NPs (right) are displayed in dashed blue, while the same NP mixtures in the presence of α-thrombin are represented in orange. Each image is the result of the combination of two DLS experiments with and without α-thrombin. The individual DLS measurements are shown in Figure S4 (ESI). In all cases, the molar ratio of α-thrombin: TBAs was 0.5:1. From top to bottom: (a) AuNP, (b) SPIONs and (c) AuSPION.

