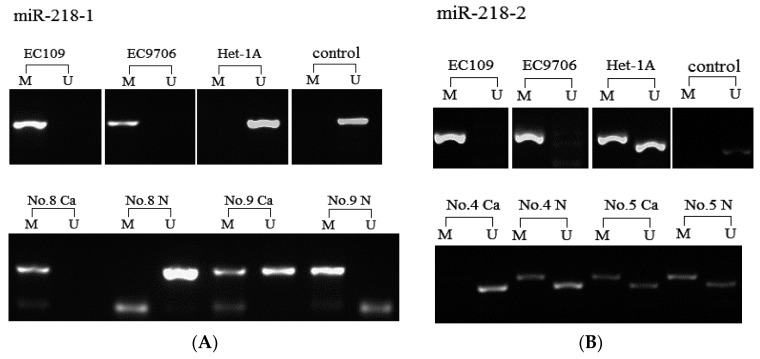
Figure 4.
Detection of aberrant hypermethylation of the miR-218 by MSP analysis in cell lines and tissue samples. “M” represents PCR amplification using primers specific for methylated samples. “U” represents PCR amplification using primers specific for unmethylated samples. “Control” represents negative control from healthy human peripheral blood. “Ca” and “N” represent tumor tissues and paired non-tumor tissues, respectively. (A) CpG methylation of miR-218-1 in cells and tissues; and (B) CpG methylation of miR-218-2 in cells and tissues.

