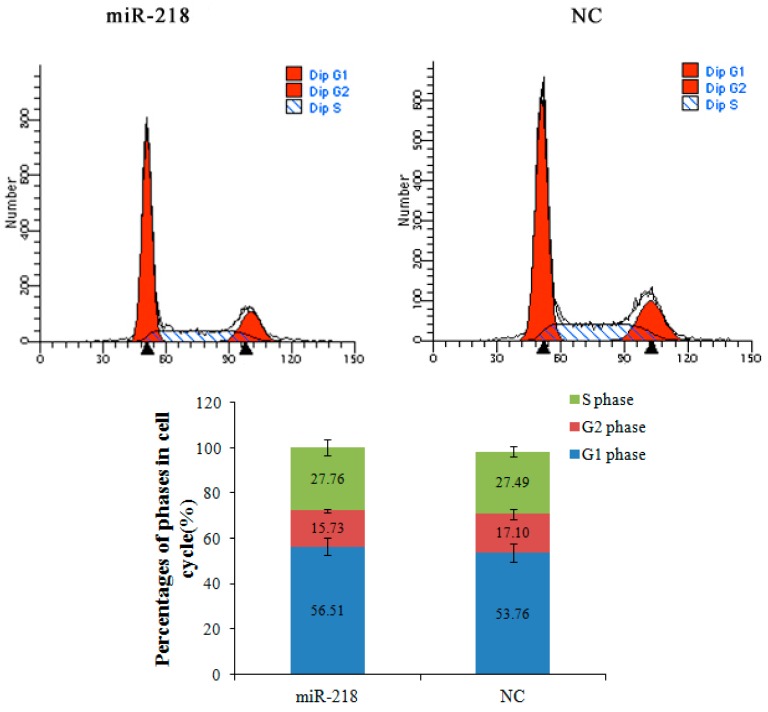
Figure 7.
miR-218 arrested cell cycle at G1 phase. Flow cytometry analysis was performed to determine the constitution of cell cycle in miR-218 mimic treated cells and negative control cells. Histograms represent percentages of cells in each cell cycle phase. The cell percentage at different phases showed a cell cycle arrest in G1 phase when treated with miR-218 mimic (p < 0.01). NC: negative control.

