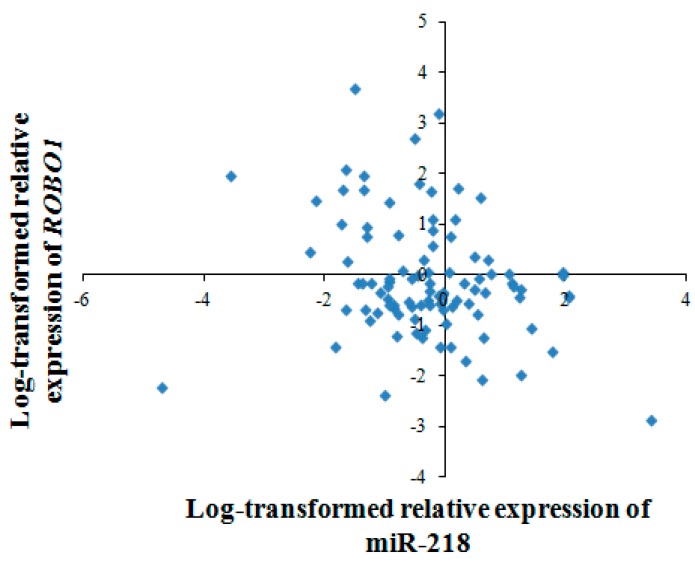
Figure 9.
Association of miR-218 and ROBO1 in ESCC tissues. The scatter plot showed a significant negative correlation between miR-218 and ROBO1 (spearman coefficient = −0.258, p < 0.05). Expression levels of miR-218 and ROBO1 are normalized by U6 and β-actin, respectively. Results are expressed as log-transformed relative gene expression (2−ΔΔCt).

