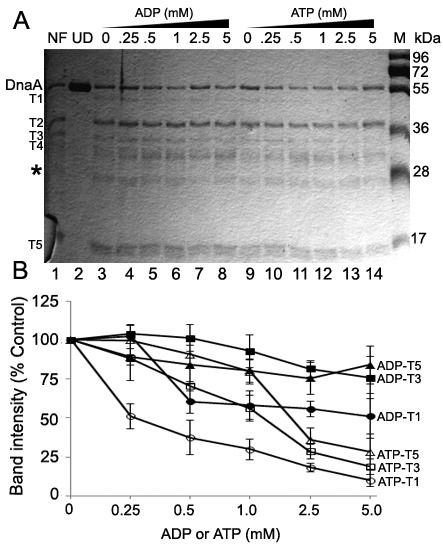
Figure 2.

ATP-DnaA and ADP-DnaA have different susceptibility to trypsin proteolysis. (A) Nucleotide free, ADP and ATP-DnaA protein (1.5 μM) were subjected to proteolysis by trypsin (protein: protease molar ratio of 4.0) in the presence of additional ADP and ATP for 30 min at 30 °C. Lane 1, Nucleotide free DnaA (NF) treated with trypsin; Lane 2, undigested (UD) nucleotide free DnaA; Lane 3, ADP-DnaA treated with trypsin; Lanes 4–8, ADP-DnaA treated with trypsin in the presence of 0.25, 0.5, 1.0, 2.5 and 5 mM ADP; Lane 9, ATP-DnaA treated with trypsin; Lanes 10–14, ATP-DnaA treated with trypsin in the presence of 0.25, 0.5, 1.0, 2.5 and 5 mM ATP; (B) A value of 100 corresponds to the intensity of the Fragments T1, T3, T5 present in the ADP-DnaA and ATP-DnaA (Lanes 3 and 9, i.e., no additional ADP or ATP in the reactions) respective to the band intensities present at each nucleotides concentration. Asterisk (*) indicates the respective position of the band for trypsin and the numbers denote the molecular weight in kDa. Densitometry values for band intensity corresponding to each proteolytic fragment were calculated using an identical size area minus a same size area in a protein free background from part of the gel. Data shown here is the mean (±SD) from three independent experiments. The SDS-PAGE from one of the experiment is shown.
