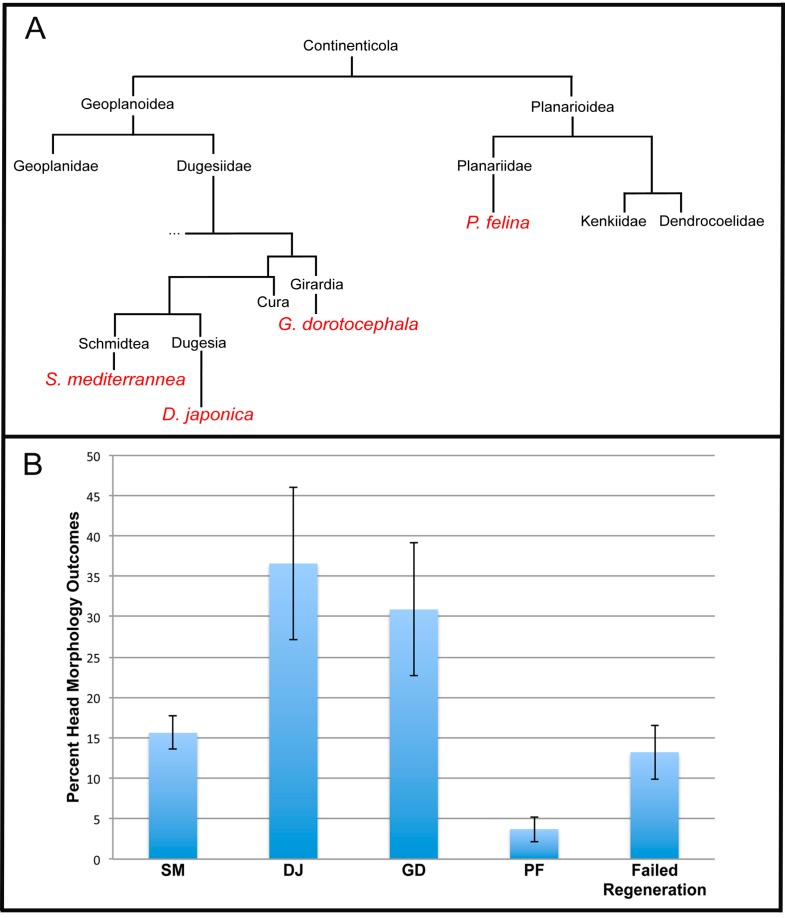
Figure 3.
Percentage of head shape outcomes correlates with evolutionary distance. (A) Evolutionary tree, constructed from rRNA data, showing relationships between species of interest. Species names in red are those that were analyzed in this work; (B) Frequency of head shapes obtained in the octanol exposure experiments (n > 243). Failure to regenerate is defined as the loss of anterior-posterior polarity, and the failure to regenerate any head at all after octanol treatment. Error bars are standard deviations.

