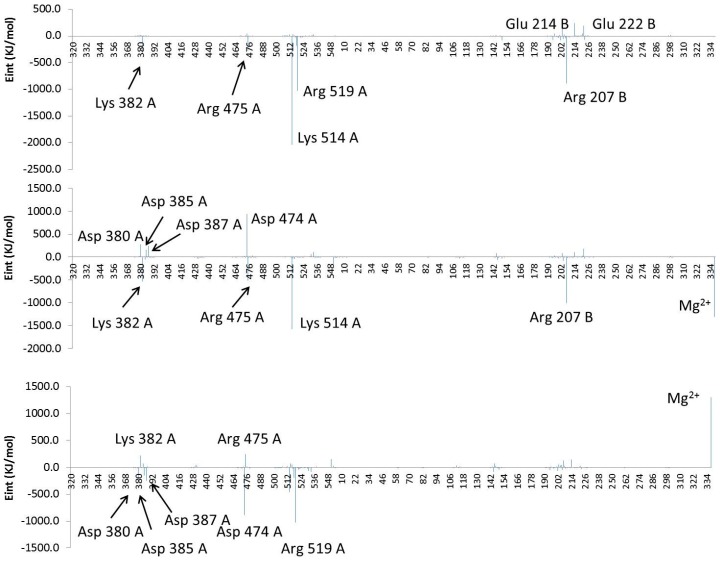
Figure 8.
Contribution of individual amino acids to (poly-P)-protein interaction energy (Eint, in kJ·mol−1) for the wild type (top panel), 1H2 mutant (middle panel) and differences between both systems (bottom panel). Residues are ordered according to the sequence, and the Mg2+ ions are added at the end. Results derived from the QM–MM interaction term of the QM/MM optimizations.

