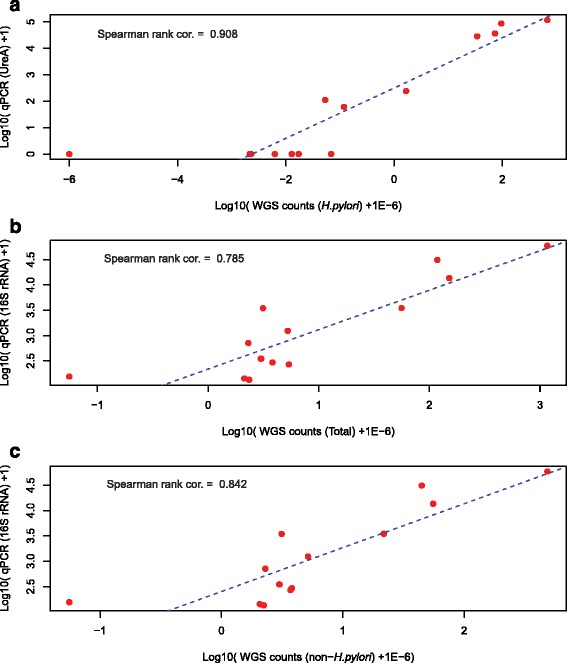
Fig. 4.

Correlation between qPCR-based bacterial quantification and WGS read counts. a Correlation plot between H. pylori-specific ureA gene-based qPCR results and WGS read counts (normalized by counts per million (CPM) reads) mapped to H. pylori. b Correlation plot between 16S rRNA gene-based qPCR results and total WGS read counts mapped to all bacterial genomes. c Correlation plot between 16S rRNA gene-based qPCR results and WGS read counts mapped to non-H. pylori genomes. In three cases qPCR measurements were derived from a sample that was adjacent to the WGS sample whereas in all other cases qPCR and WGS were performed on the same biopsy. Blue dashed lines are the linear regression models
