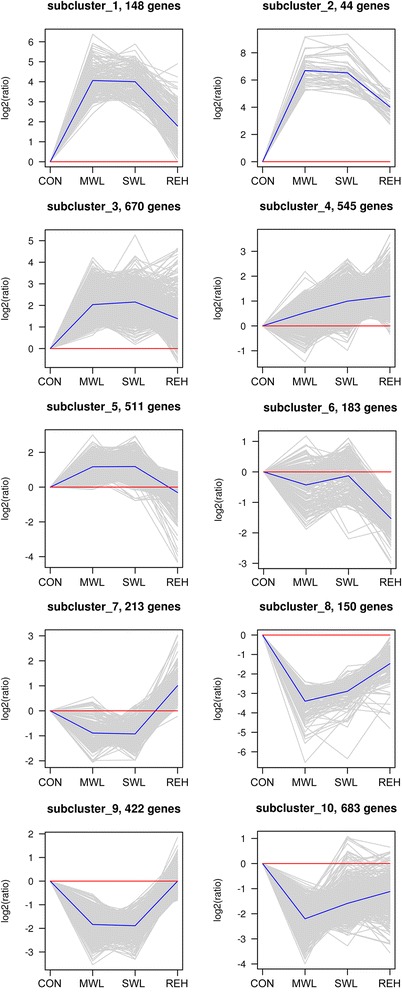
Fig. 2.

Expression graphs of subclusters identified by the hierarchical cluster analysis. Ten subclusters represent expression signatures of 3,569 differentially expressed genes of Py. haitanensis using four different treatments. The x-axis represents the treatments. The y-axis represents the value of the relative expression level [log2 (ratio)]. The gray line represents the value of the relative expression level, the blue line represents the mean value of the relative expression level, and the red line is the reference
