Fig. 3.

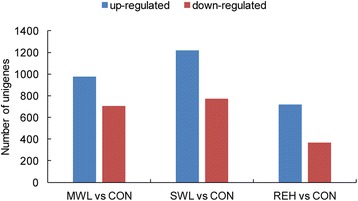
The changes in gene expression profile among the different treatments. Unigenes upregulated (blue) and downregulated (red) in MWL vs. CON, SWL vs. CON, and REH vs. CON were quantified

The changes in gene expression profile among the different treatments. Unigenes upregulated (blue) and downregulated (red) in MWL vs. CON, SWL vs. CON, and REH vs. CON were quantified