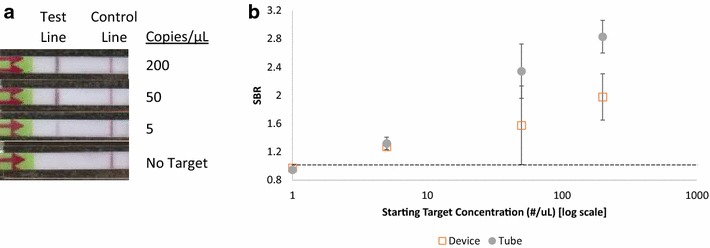
Fig. 4.

Demonstration of performance of paper and plastic device. a Representative images of the lateral flow strips run in the devices. b Comparison of the averaged SBR of samples run in the device and in tubes (n = 3), the error bars represent ±1 standard deviation. Strips were positive by SBR if they were more than 3 standard deviations above the averaged no target control SBR, shown as a dotted line on the figure
