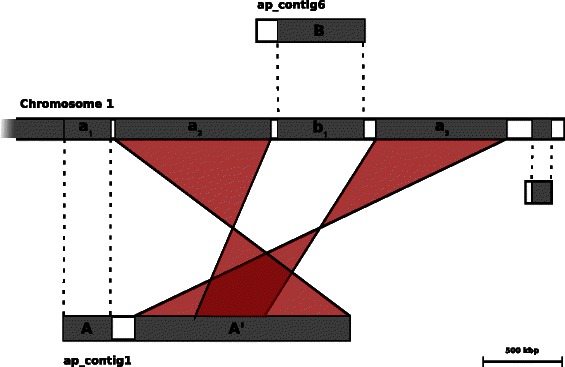
Fig. 3.

Placement of ap_contig1 to optical map Chromosome 1. An illustration re-drawn from the output of the OpGen’s Mapsolver software, where in silico digested allpaths-lg contigs are placed to the optical map Chromosome 1. It shows a complex rearrangement where flaws in the allpaths-lg assembly are corrected. The 1.38 Mbp region A´ of ap_contig1 is a collapsed repeat structure, which the optical map was able to resolve and subsequently could be placed to regions a1 and a2 of Chromosome 1. This map placement is highlighted in transparent red for clarity and shows that the sequences were placed in inversed orientation. Furthermore, a2 and a3 are flanking the placed sequence b1, originating from the B region of the contig ap_contig6. On the left flank of B is an unplaced region whose restriction enzyme cuts could not be aligned to the cuts made by the Argus system, and is likely the result of mis-assembly
