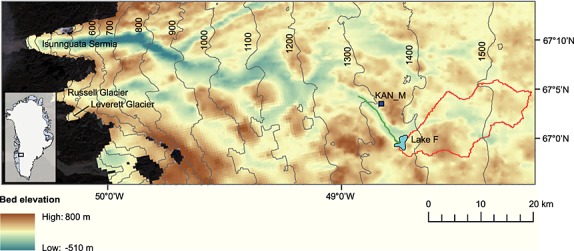
Figure 1.

Bed elevation map of the Russell Glacier catchment with surface elevation plotted as 100 m contours. The basal digital elevation model (DEM) was produced following Lindbäck et al. [2014]. The background image is a LANDSAT TM output from 18 August 2010. Also plotted are the location of Lake F (light blue), the Lake F catchment area (red), the model flowline (green), and the KAN_M automatic weather station (dark blue).
