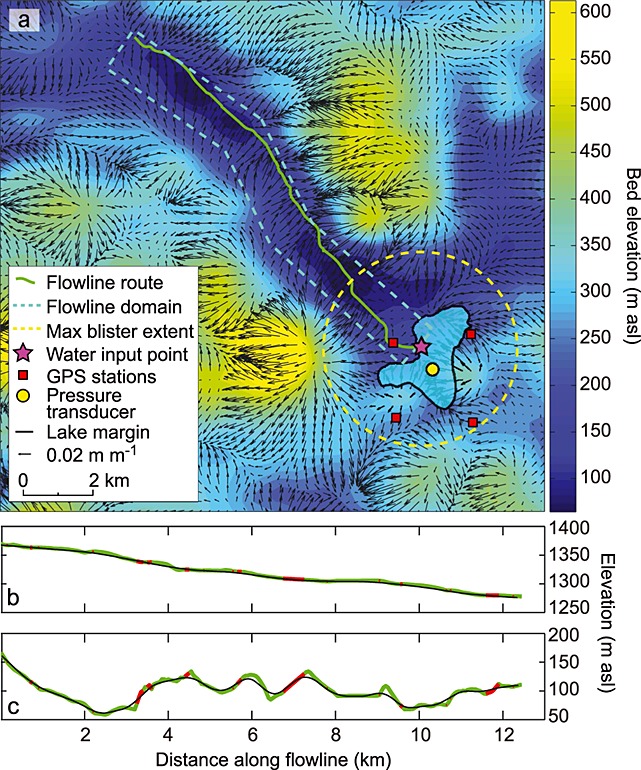
Figure 2.

(a) Basal DEM of the Lake F region with hydraulic potential vectors. Hydraulic potential gradients are calculated assuming the lake is full and basal water pressures are everywhere at overburden. The extent of Lake F just prior to drainage is shown in opaque blue. The extent and route of the flowline and blister domains along with the location of the GPS stations, pressure transducer, and the water input point at the bed estimated from passive seismic records are indicated. (b and c) Surface and bed topography along the flowline (green) in Figure 2a with red areas showing regions where hydraulic potential gradients are reversed at overburden pressure. The black curves show the smoothed surface and bed used in the model runs.
