
Figure 1. Normative Left Amygdala Connectivity and Regions Showing Significant Regression Effects.
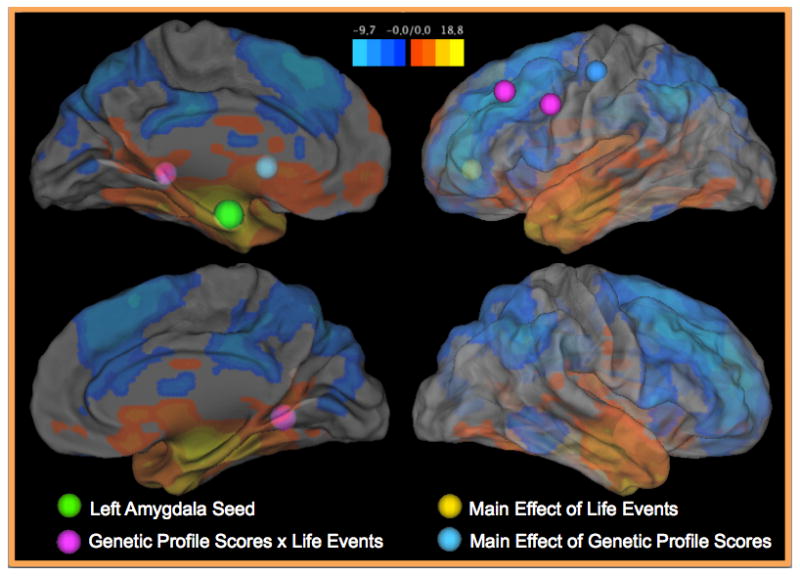
This figure presents a surface rendering of the normative resting state connectivity patterns found with the left amygdala. Specifically, colors on the surface indicate z-statistics for the whole-brain one-sample t-test indicating areas that show significant connectivity with the left amygdala. The normative connectivity results are also presented in axial slices in Figure S1. The center of the left amygdala seed is indicated by a green sphere. Other spheres indicate the peaks of regression effects: blue = main effects of genetic profile scores; yellow = main effects of life events; purple = genetic profile score x life events interactions. Axial slices through these regions showing altered connectivity are presented in Figure S3.