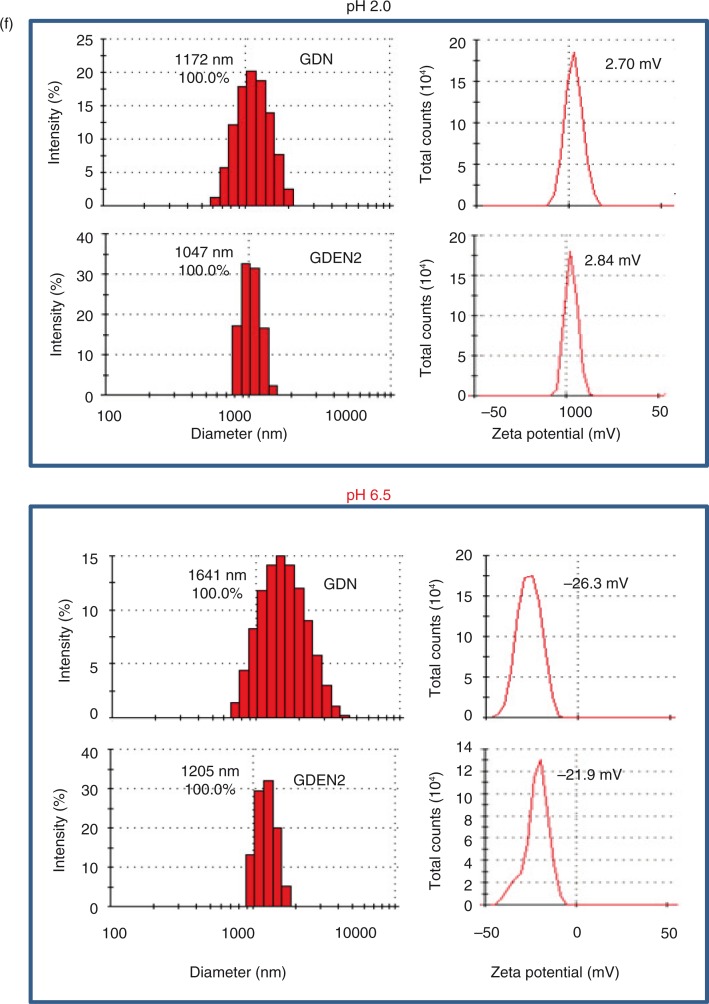
Fig. 1.
Identification and characterization of ginger-derived nanoparticles (GDNs). (a) Two bands from sucrose-banded ginger rhizome root–derived samples were formed after gradient ultracentrifugation (left). GDN and GDEN2 particles were visualized by atomic force microscopy (AFM, right). (b) Size distribution (left) and surface zeta-potential (right) of the particles were determined using a Zetasizer Nano ZS. (c) Pie chart with a summary of the putative lipid species in GDN and GDEN2, reported as the percentage of total GDENs lipids. Major details are reported in Supplementary Table I. PA: phosphatidic acids; PS: phosphatidyl serine; PI: phosphatidyl inositol; PE: phosphatidyl ethanolamines; PC: phosphatidyl choline; PG: phosphatidyl glycerol; MG/DG: mono/di/glycerols. LysoPG: lysophosphatidyl glycerol; LysoPC: lysophosphatidyl choline; LysoPE: lysophosphatidyl ethanolamines. (d) TLCs (left) and HPLC (right) analysis of the lipid extracts from GDN and GDEN2. A standard shogaol (left panel, the 1st lane) or gingerol (left panel, the 2nd lane) were used as markers, (e) TLCs analysis of the lipid extracts from ginger extracts, ginger microparticles, pellet including GDN plus GDEN2, and ginger extracts with GDN and GDEN2 depleted, (f) GDN or GDEN2 was incubated in a stomach-like solution (top panel) for 60 min at 37°C and subsequently in small intestinal-like solution (bottom panel) for an additional 60 min at 37°C. Size distribution and surface zeta-potential changes were measured by Zetasizer Nano ZS. Results (a–f) represent at least 3 independent experiments.

