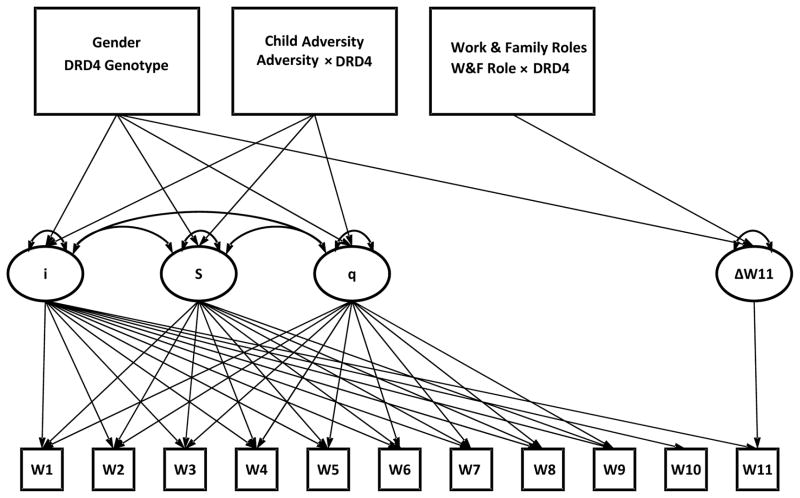
Figure 1.
Path Diagram for Latent Growth Curve Model of AD Symptoms with Covariates.
Note. Basis coefficients from intercept (i) factor to observed AD symptoms fixed to 1 at all waves. Basis coefficients from linear slope (s) factor to observed AD symptoms fixed at 9:1 at waves 1 through 9, respectively, and were fixed to 0 at waves 10 and 11. Basis coefficients from quadratic slope (q) factor to observed AD symptoms fixed to (9:1)2 at waves 1 through 9, respectively. Basis coefficient from wave 11 change factor (Δw11) fixed to 1.0. Residual variances estimated and allowed to vary across waves 1–10. Residual variance at wave 11 fixed to zero.

