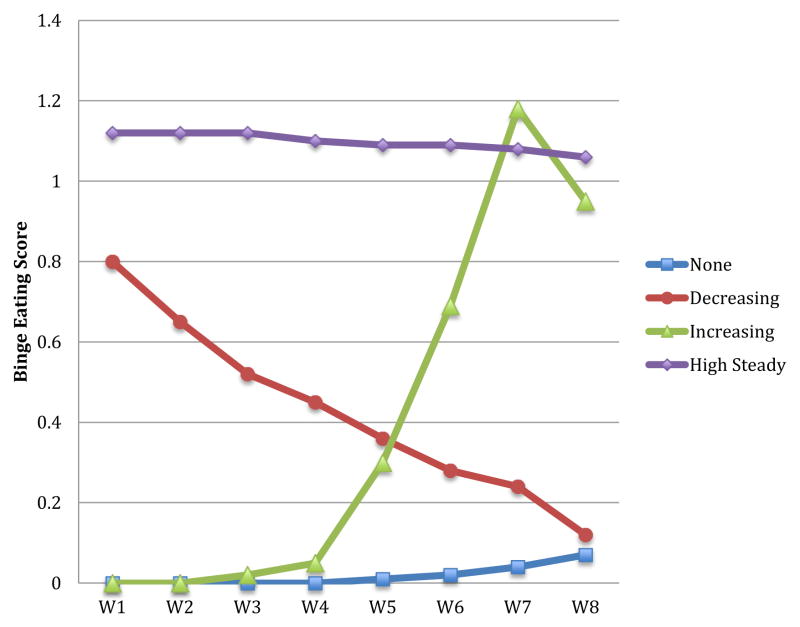
Figure 1. Binge Eating Trajectory Groups.
Note: These lines represent the smoothed curves for each group's change over time. On the x-axis, each wave represents 6 months of development, except between W7 and W8, which represents 12 months of development. Waves 1-7 refer to biannual data collections, which occurred in every 6 months beginning in the spring of 5th grade (W1) through the spring of 8th grade (W7). W8 refers to the fall of 9th grade, the last data collection, which took place one year after W7. Scores of 1 represent 1-2 binge eating episodes in the past 2 weeks from assessment and scores of 2 represent 2-3 binge eating episodes in the past 2 weeks from assessment. None-binge eating, n = 517; Decreasing binge eating, n =218; Increasing binge eating, n = 110; High Steady binge eating, n = 93.

