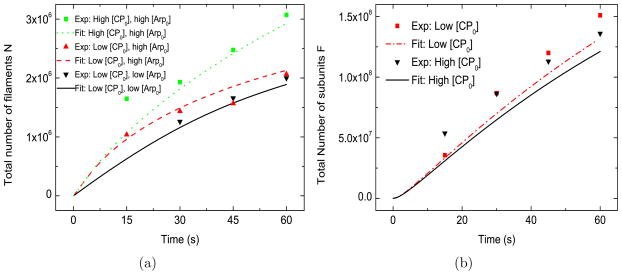
Figure 2.
Baseline model. [G0] =2.2 μM, kbr=0.65 μM−2s−1, ksp=1.0 ×10⁴ μM−2s−1, [Arpc] = 2 nM . Low [CP0] = 21 nM , high [CP0] = 52 nM . Low [Arp0] = 48 nM , high [Arp0] = 96 nM . In this and following figures, an estimate of the nonspecific association of CP to the beads was subtracted from filament numbers quoted in Ref. [13]. This was obtained by linear interpolation of the data in Fig. S5 of Ref. [13].

