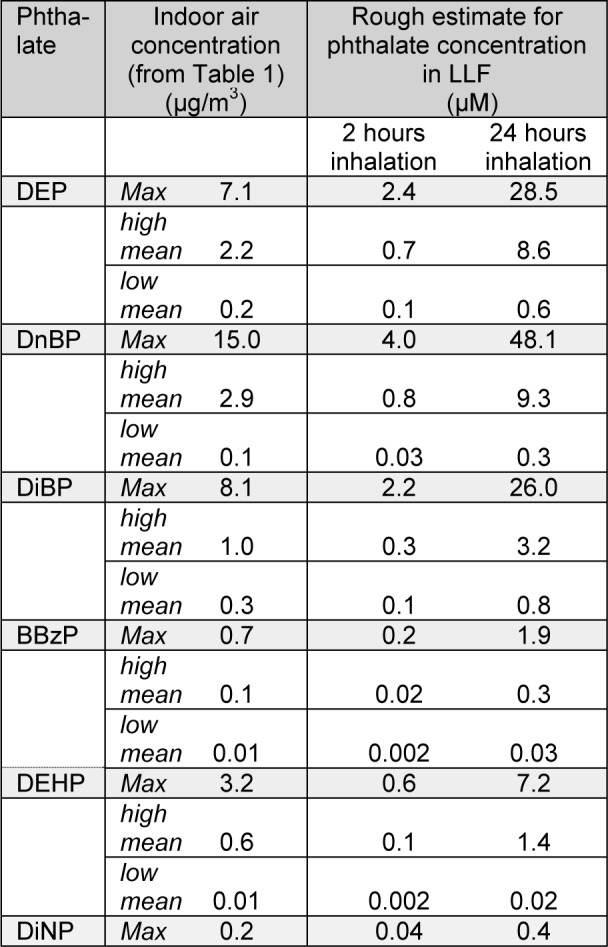
Table 2. Rough estimates of pulmonary phthalate concentrations due to inhalation exposure. The table shows the maximum levels reported for each phthalate as well as the highest and lowest mean values, for each phthalate, and the corresponding calculated concentrations of phthalates in LLF after 2 or 24 hours inhalation. See main text for assumptions and explanation of calculations.

