. 2014 Dec 31;34(6):829–835. doi: 10.5851/kosfa.2014.34.6.829

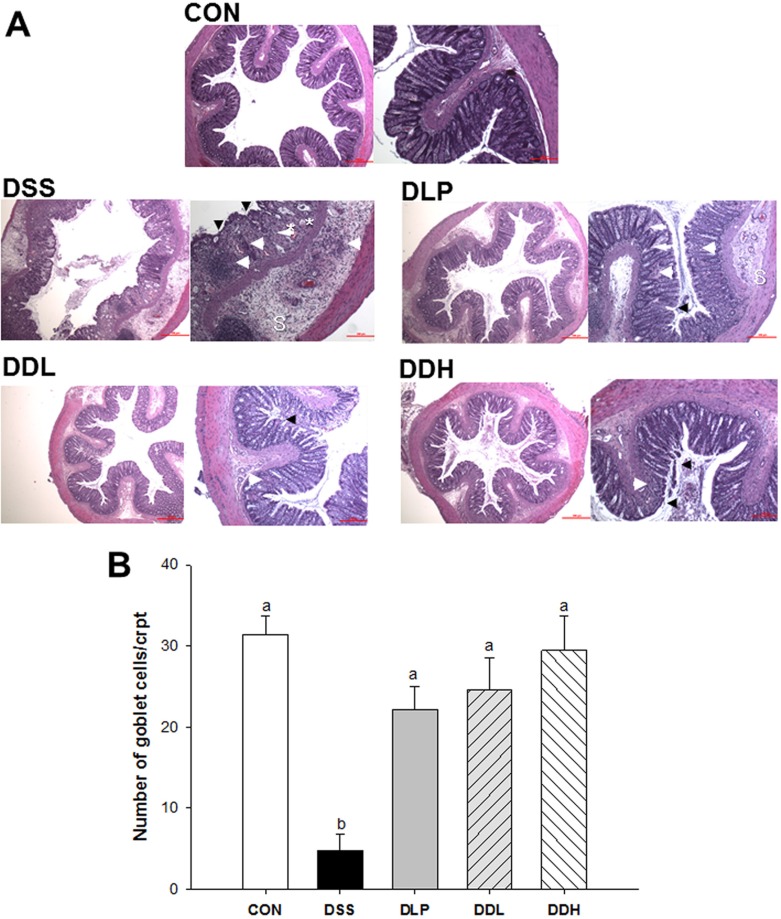
Fig. 2. Representative colon histopathology images of colons (A), and the number of goblet cells in colonic crypts (B) in DSS-induced colitic rats during the period of colitis induction. CON (Control, non-colitis induced, n=10), DSS (colitis induced, n=9), DLP (colitis induced + 1×10⁹ CFU/d live Lb. plantarum K8, n=9), DDL (colitis induced + 1×10⁹ CFU/d lysate of Lb. plantarum K8, n=10), DDH (colitis induced + 1×10¹⁰ CFU/d lysate of Lb. plantarum K8, n=9). All values are expressed as means±SE. Statistical significance was determined using one-way ANOVA. Different letters indicate significant differences at the p<0.05 level using Duncan’s multiple range test. Glandular epithelium destruction (arrowhead), neutrophil infiltration (arrow), edema (sharp arrow), cryptic dilatation (*), or submucosal extension of inflammation (S). H&E stain; bar, 100 μm and 500 μm.

Fig. 2.