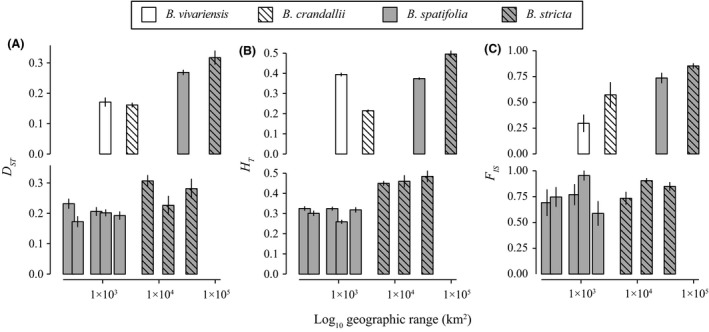
Figure 5.

Comparison of statistics derived from full‐species samples (top row) and spatially subsampled distributions of the widespread species (bottom row). Due to denser population sampling, we were able to define five subsampled groups for B. spatifolia, but only three for B. stricta. Three statistics are presented for each species and subsample: D ST (panel A), H T (panel B), F IS (panel C).
