Figure 6.

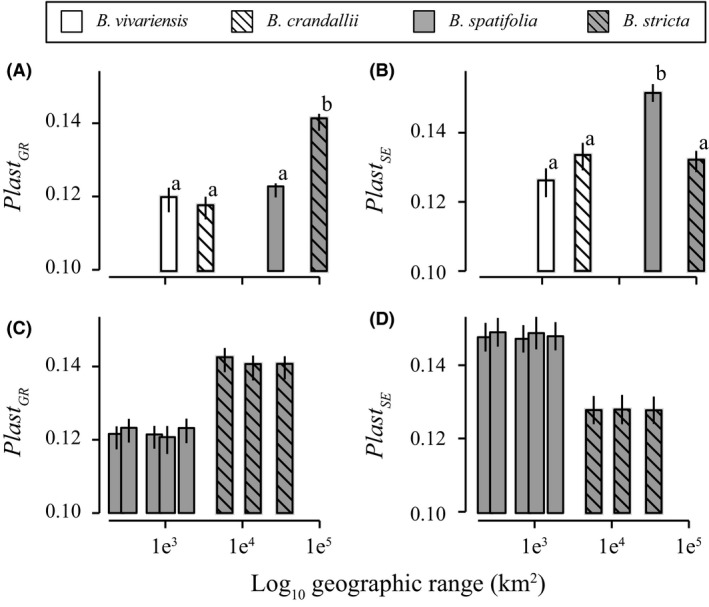
Phenotypic plasticity of the full samples (A, B) and spatial population subsampling of the widespread species (C, D). Means (+/‐ the standard deviation of 1000 bootstraps) are presented.

Phenotypic plasticity of the full samples (A, B) and spatial population subsampling of the widespread species (C, D). Means (+/‐ the standard deviation of 1000 bootstraps) are presented.