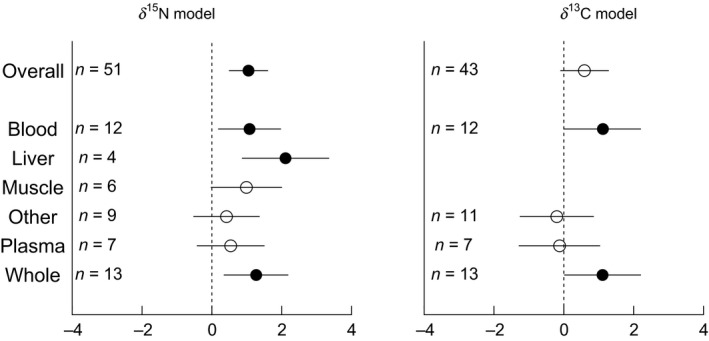
Figure 5.

Tissue‐specific responses of the effect sizes (with 95% confidence intervals) from δ 15N and δ 13C random‐effects models. Effect sizes that are significantly different from zero are shown in filled circles, while confidence intervals that overlap the dashed vertical line at zero are not significant (open circles).
