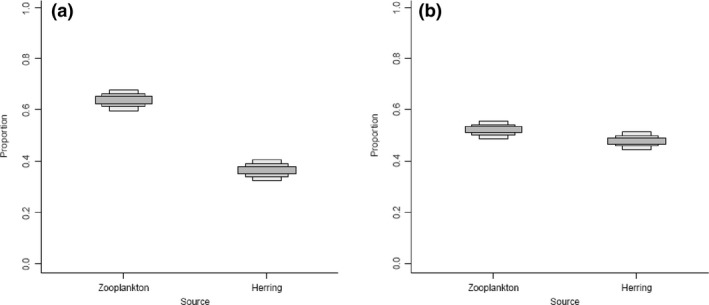
Figure 6.

Credible interval plot from SIAR of the contribution of different diet sources to juvenile Chinook Salmon muscle tissue. Intervals go from 50%, 75%, and 95% credible intervals from dark to light gray boxes. (A) is the results from the sampled fish, while (B) is the simulated results with each juvenile Chinook Salmon having δ 15N values increased by the results found in this study (0.50‰).
