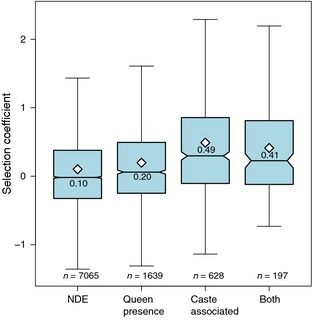
Figure 4.

Box and whisker plots of population size‐calibrated selection coefficients (γ) for nondifferentially expressed genes (NDE), nurse and larval genes with expression associated with queen presence (“queen presence”), nurse and larval genes with expression associated with caste development (“caste”), and nurse and larval genes with expression associated with both queen presence and caste in different tissues (“both”). Genes that were nondifferentially expressed or had expression only dependent on queen presence had lower selection coefficients than genes with caste‐associated expression or both caste‐ and queen presence‐associated expressions. Means are indicated by white diamonds and also printed in each box. Outliers are removed for clarity.
