
Figure 8.
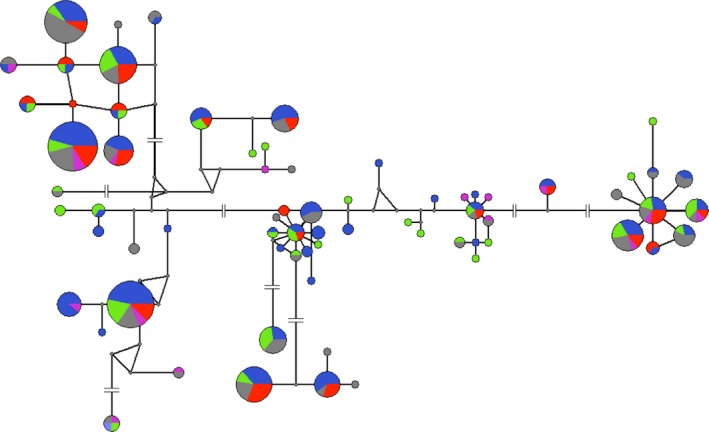
Network of MHC class II DRB exon 2 alleles (nucleotide level) with nodes proportional to frequency of individuals carrying the allele, colored by the biomes in which it occurs: Atlantic forest (blue, n = 29), Amazon forest (green, n = 9), Cerrado (gray, n = 16), Caatinga (violet, n = 3), and Pantanal (red, n = 8). Interruptions in lines represent the presence of more than ten mutations.