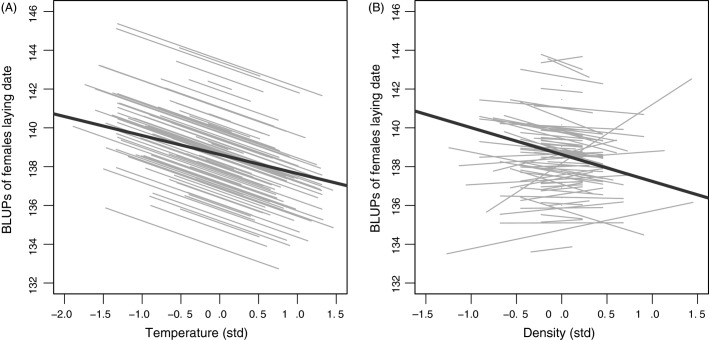
Figure 4.
Best linear unbiased predictions (BLUPs; grey lines) for 100 female tree swallows (randomly chosen over a possibility of 370) from the random regression model (model 5, Table3) of individual plasticity in laying date (Julian days), for within-individual component (βW) of standardized (A) spring temperature and (B) breeder density. Bold black lines represent predictions from between-individual components (βB).

