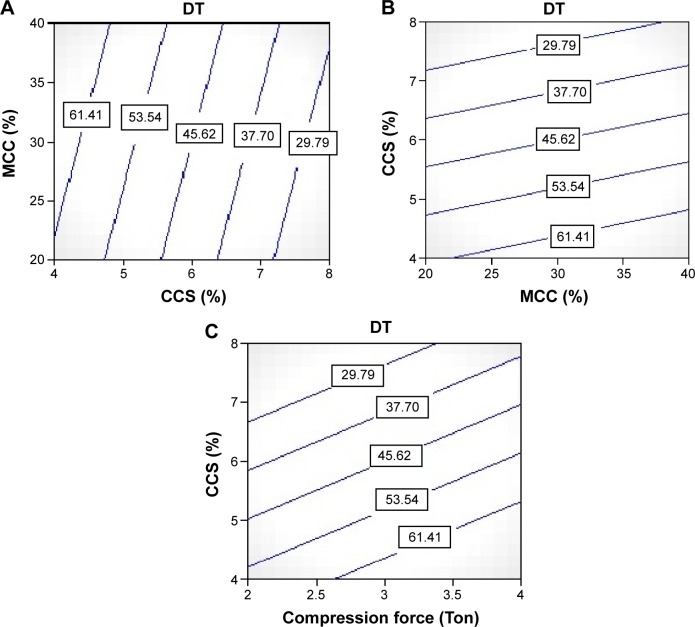
Figure 2.
Counter plots showing effect of independent variables on dependent variables (DT).
Notes: (A) Contour plot showing effect of CCS on the DT of tablets, (B) contour plot showing effect of MCC on the DT of tablets, (C) contour plot showing effect of compression force on the DT of tablets.
Abbreviations: CCS, croscarmellose sodium; DT, disintegration time; MCC, microcrystalline cellulose.

