
Figure 1. PARP1: gene status, mRNA and protein expression.
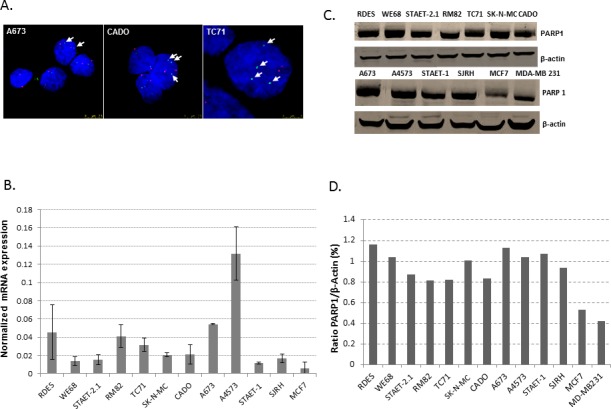
A. FISH of PARP1. ES cell lines previously described as 1qG showed extra-copies of PARP1 (CADO and TC71 cell lines) whereas A673, described as 1qN, showed only two copies of PARP1 by FISH. Green and red dots represent PARP1 gene copies and 1q centromeres, respectively. Arrows also indicate the green dots (PARP1 gene copies). B. q-RT-PCR shows that PARP1 expression is heterogeneous among the ES cell lines studied. SJRH also express PARP1 at similar levels to the ES cell lines. A4573 (1qG) and A673 (1qN) are the cell lines with the highest expression of PARP1. The MCF7 breast cancer cell line was used as a positive control. C. Western blotting showed that ES cell lines express PARP1 under normal conditions. Here, breast cancer cell lines (MCF7 and MD-MB 23) were used as positive controls. D. Quantification of PARP1 protein levels with respect to β-actin expression using Image J software.