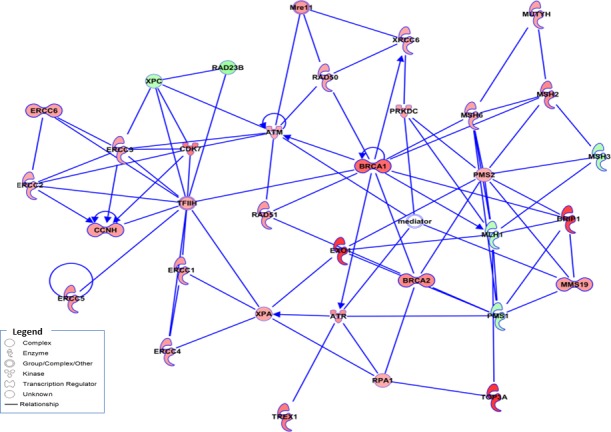
Figure 4. Expression changes in DNA damage repair genes in ES cells from the TC71 cell line.

Schematic representation of gene interactions in cells treated with the combination of Olaparib (5μM) and Trabectedin (250pM), obtained after performing IPA. Over-expressed genes are highlighted in red, and the down-regulated genes are highlighted in green. The central genes involved in HR machinery are highlighted in color, such as BRAC1, EXO1, RAD51 and BRCA2, among others.
