
Figure 6. Immunofluorescence and Immunohistochemical analysis of tumor xenografts: Apoptosis, proliferation and DNA damage induction.
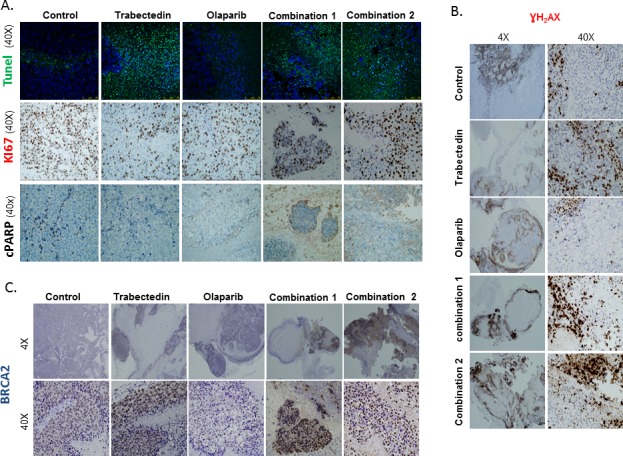
A. The images show a higher number of Ki67 positive cells in the control group as compared to tumors treated with Trabectedin alone or with the combinations of Olaparib and Trabectedin (central panel). In the TUNEL assay, cell staining was mostly observed in tumors from the Trabectedin group and from the combination groups (upper panel). PARP cleavage only revealed a slight staining in the Olaparib group. B. The images show intranuclear γH2AX staining in tumors from all the groups but it is more extensive and intense mainly in non-necrotic areas of the tumors from the Olaparib and Trabectedin combinations. C. The images show an intense, focal BRCA2 staining in tumors from the Trabectedin and the combination groups. Very little expression was observed in the Olaparib group. Combination1 refers to 100mg/kg Olaparib and 0.15mg/kg Trabectedin, which started to be administered after day 7. Combination2 refers to Olaparib and 0.15mg/kg.Trabectedin.