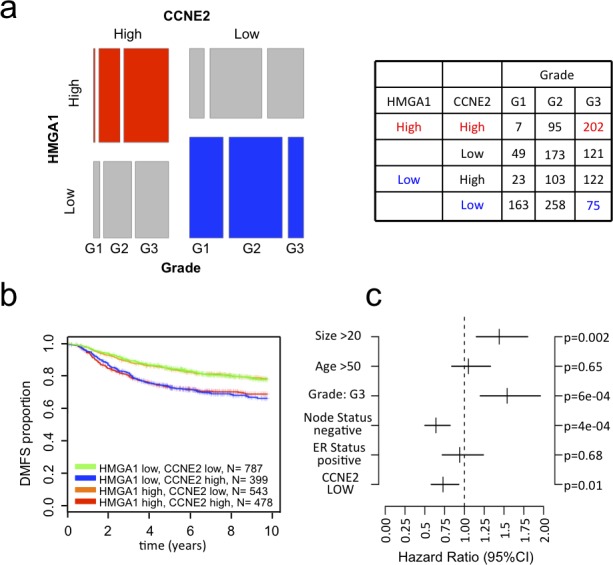
Figure 2. CCNE2 expression correlates with HMGA1 expression in breast cancer and tumor aggressiveness.

a. Mosaic plot showing the expression of HMGA1 and CCNE2 in breast cancer samples. The samples were stratified based on tumor grade and the expression of these two genes (higher or lower that the mean expression of the given gene in the meta-dataset). The table shows the number of samples for each category. b. Kaplan–Meier survival curves showing the relevance of CCNE2 and HMGA1 expression to clinical outcome, specifically DMFS. The patients were stratified based on the expression of these two genes. c. Multivariate analysis of CCNE2 expression in a breast cancer meta-dataset.
