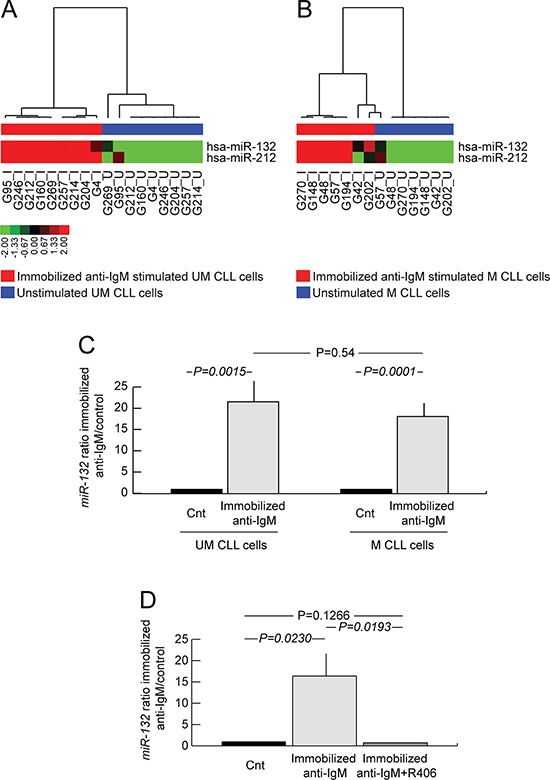
Figure 1. miR-132 induction upon anti-IgM stimulation of CLL cells.

A. miRome of UM CLL cells upon immobilized anti-IgM stimulation. Hierarchical clustering of immobilized anti-IgM stimulated (red bar under the horizontal dendrogram) and unstimulated (blue bar under the horizontal dendrogram) UM CLL cell samples (9 cases) is shown. Color codes for microRNA expression values refer to mean centered log-ratio values. B. miRome of M CLL cells upon immobilized anti-IgM stimulation. Hierarchical clustering of immobilized anti-IgM stimulated (red bar under the horizontal dendrogram) and unstimulated (blue bar under the horizontal dendrogram) M CLL cell samples (7 cases) is shown. Color codes for microRNA expression values refer to mean centered log-ratio values. C. qRT-PCR analysis of miR-132 expression in immobilized anti-IgM stimulated and unstimulated CLL cell samples (12 UM and 16 M). D. qRT-PCR analysis of miR-132 expression in unstimulated CLL cells, or immobilized anti-IgM stimulated, or immobilized anti-IgM plus R406 (4 UM and 4 M). In all graphs data represent mean ± SEM; P values refers to Student's t-test.
