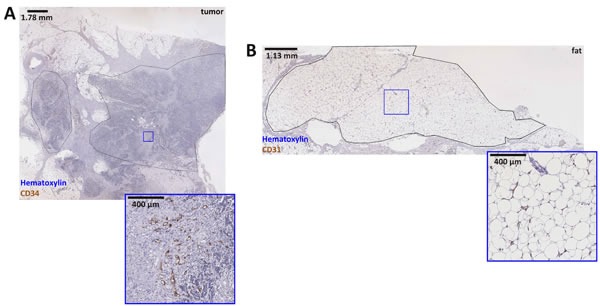
Figure 2. Whole slide image of a colorectal tumor sample.

Panel A. shows a whole slide image of a colorectal cancer sample, two tumor regions are delineated by hand. Analysis of the right-hand region is subsequently shown in Figure. 4. Below, a detail is enlarged to demonstrate the staining quality. In panel B. a fat tissue sample is shown. The delineated fat tissue region served as a negative control for validation of the new method. Below the main panel, a detail is enlarged. The corresponding blood vessel map can be found in Figure 3.
