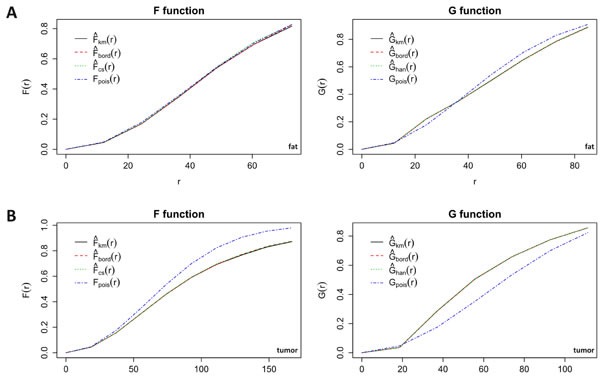
Figure 6. Spatial statistics for fat and tumor.

Empty space function F(r) and nearest neighbour distance distribution function G(r) for vessels in fat A. and tumor B. tissue. The observed functions are plotted against the functions of a corresponding random pattern. While F and G for fat do not differ from the random functions, tumor vessel distribution markedly differs from a random pattern. km = Kaplan-Meier estimate, cs = Chiu-Stoyan estimate, bord = border corrected estimate, han = Hanisch estimate, pois = theoretical Poisson distribution (CSR).
