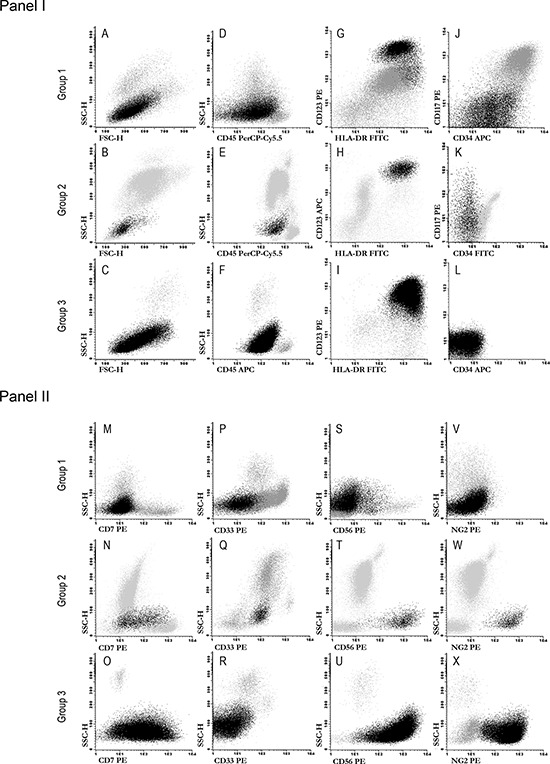
Figure 1. Illustrating dot plots of the three immunophenotypically defined groups of BPDCN.

The neoplastic plasmacytoid dendritic cell population is depicted as black dots, whereas other leukocytes are depicted in gray. Panel I: plots A to I illustrate a combination of markers which are useful for the identification of blastic pDC, while plots J to L show the pattern of expression of CD34 and CD117 for representative cases from the different maturation-associated groups of BPDC neoplasms here defined. Panel II: plots M to X display the pattern of expression observed for those markers found to be expressed at statistically different levels among the three maturation-associated groups of BPDC neoplasms.
